The importance of the direct to reverberant ratio in the perception of distance, localization, clarity, and envelopment
- The importance of the direct to reverberant ratio in the perception of distance, localization, clarity, and envelopment

Содержание
- 2. Introduction Sound engineers need (almost) no convincing about the importance of direct sound. The sound image
- 3. Barron’s Spatial Impression Diagram Barron started with direct sound in front of listener and added a
- 4. My research I used a similar setup, but employed six or more reflections at various angles
- 5. Results for D/R=+25dB to 0dB Dry speech Note the sound is uncomfortably close Mix of dry
- 6. Preference and Practice In recording practice the D/R for the combination of early and late reflections
- 7. Concert Halls Barron was interested in halls, not recordings! The critical distance in Boston Symphony Hall
- 8. Experiences – Staatsoper Berlin Barenboim gave Albrecht Krieger and I 20 minutes to adjust the LARES
- 9. Experiences – Bolshoi – a famously good hall for opera The Bolshoi is a large space
- 10. New Bolshoi before modification The Semperoper was the primary model for the design of the new
- 11. Experiences – Amsterdam Muziektheater Peter Lockwood and I spent hours adjusting the reverberant level using a
- 12. Experiences, Copenhagen New Stage We were asked to improve loudness and intelligibility of the actors in
- 13. INVOLVEMENT, not ENVELOPMENT All these experiences relate to the importance of the perception of direct sound
- 14. Main Points The ability to hear the Direct Sound – the sound energy that travels to
- 15. Main Points 2 Current acoustic measures ignore both the D/R and the time gap between the
- 16. Diffusing elements do not scale The audibility of direct sound is frequency dependent. Frequencies above 1000Hz
- 17. Sound Build-up in halls, or why do different large halls sound different? In a large hall
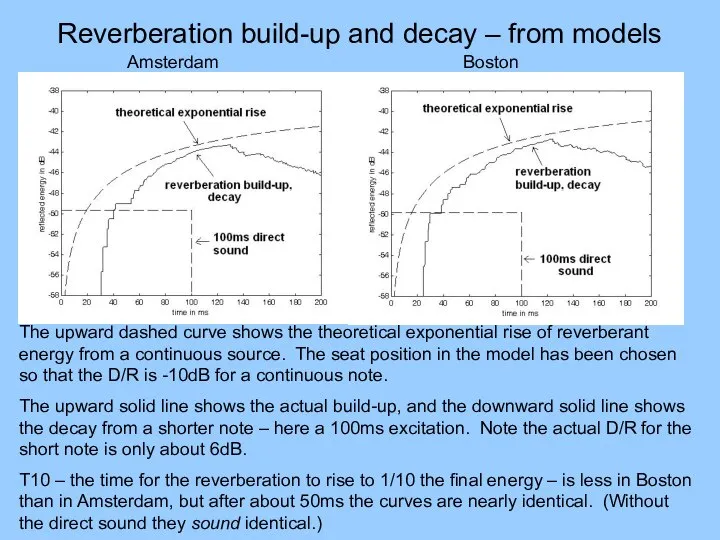
- 18. Reverberation build-up and decay – from models Amsterdam Boston The upward dashed curve shows the theoretical
- 19. Smaller halls What if we build a hall with the shape of BSH, but half the
- 20. Half-Size Boston The gap between the direct and the reverberation and the RT have become half
- 21. An existing small hall An existing small hall of 350 seats has a measured RT of
- 22. An existing small hall - pictures Note the highly reflective stage and side walls, deeply coffered
- 23. Small shoebox halls can be OK If the client insists on a shoebox it can work
- 24. Great Small Halls Exist! Jordan Hall at New England Conservatory has 1200 seats, an RT of
- 25. Williams Hall, NEC Williams hall, in the same building, has ~350 seats in a square plan
- 26. Hard learned lessons Where clarity is a problem in small halls, acousticians usually recommend adding early
- 27. Clarity and involvement come from the direct sound. Spaciousness and envelopment are provided by LATE energy.
- 28. Why do current acousticians emphasize early reflections? I believe the current emphasis on early reflections (which
- 29. Threshold Data Onset and azimuth thresholds allow hall sound to be predicted from models! 1. Thresholds
- 30. Experiment for threshold of Azimuth Detection in halls A model is constructed with a source position
- 31. Threshold for azimuth detection as a function of T10 As the time gap between the direct
- 32. An important caveat! All these thresholds were measured without visual cues The author has found that
- 33. How to use the Thresholds These thresholds provide guidelines for hall design. As a first approximation
- 34. In practice the D/R is different than expected from classical acoustics The D/R is frequency dependent
- 35. Light models I ran across these pictures while cleaning out my office. The top one is
- 36. Modeling T10 Classical acoustics predicts a starting value for d/r. We can make a chart of
- 37. Onset Enhancement When d/r is low a small amount of direct sound sharpens the perceived onset
- 38. Small Hall Shapes A large hall like Boston has many seats above threshold, and many that
- 39. Retro reflectors above 1000Hz Boston, Amsterdam, and Vienna all have side-wall and ceiling elements that reflect
- 40. High frequency retro reflectors Rectangular wall features scatter in three dimensions – visualize these with the
- 41. High frequency overhead filters A canopy made of surfaces separated by some distance becomes a high
- 42. Binaural Measures The author has been recording performances binaurally for years. Current technology uses probe microphones
- 43. Localization The figure shows the number of times per second that a solo violin can be
- 44. Localization – surface1 Here we plot the same data for the violin as a function of
- 45. Localization, Surface 2 Here we plot 1/(1-IACC) as a function of time and third octave band.
- 46. Localization – a poor seat Here is a similar diagram for a solo violin in row
- 47. Measures based on harmonic coherence When the formant frequencies above 1000Hz are disturbed by reflections, the
- 48. Another singer The king (in Verdi’s Don Carlos) on the other hand, in his wonderful solo
- 49. Some demos of eardrum recordings These recordings have been equalized for loudspeaker reproduction. You may be
- 51. Скачать презентацию

Introduction
Sound engineers need (almost) no convincing about the importance of direct
Introduction
Sound engineers need (almost) no convincing about the importance of direct

Barron’s Spatial Impression Diagram
Barron started with direct sound in front of
Barron’s Spatial Impression Diagram
Barron started with direct sound in front of

My research
I used a similar setup, but employed six or
My research
I used a similar setup, but employed six or

Results for D/R=+25dB to 0dB
Dry speech
Note the sound is uncomfortably close
Mix
Results for D/R=+25dB to 0dB
Dry speech
Note the sound is uncomfortably close
Mix

Preference and Practice
In recording practice the D/R for the combination of
Preference and Practice
In recording practice the D/R for the combination of

Concert Halls
Barron was interested in halls, not recordings!
The critical distance in
Concert Halls
Barron was interested in halls, not recordings!
The critical distance in

Experiences – Staatsoper Berlin
Barenboim gave Albrecht Krieger and I 20 minutes
Experiences – Staatsoper Berlin
Barenboim gave Albrecht Krieger and I 20 minutes

Experiences – Bolshoi – a famously good hall for opera
The Bolshoi
Experiences – Bolshoi – a famously good hall for opera
The Bolshoi

New Bolshoi before modification
The Semperoper was the primary model for the
New Bolshoi before modification
The Semperoper was the primary model for the

Experiences – Amsterdam Muziektheater
Peter Lockwood and I spent hours adjusting the
Experiences – Amsterdam Muziektheater
Peter Lockwood and I spent hours adjusting the

Experiences, Copenhagen New Stage
We were asked to improve loudness and intelligibility
Experiences, Copenhagen New Stage
We were asked to improve loudness and intelligibility

INVOLVEMENT, not ENVELOPMENT
All these experiences relate to the importance of the
INVOLVEMENT, not ENVELOPMENT
All these experiences relate to the importance of the

Main Points
The ability to hear the Direct Sound – the sound
Main Points
The ability to hear the Direct Sound – the sound

Main Points 2
Current acoustic measures ignore both the D/R and the
Main Points 2
Current acoustic measures ignore both the D/R and the

Diffusing elements do not scale
The audibility of direct sound is frequency
Diffusing elements do not scale
The audibility of direct sound is frequency
Sound Build-up in halls, or why do different large halls sound
Sound Build-up in halls, or why do different large halls sound
Reverberation build-up and decay – from models
Amsterdam Boston
The upward dashed curve
Reverberation build-up and decay – from models
Amsterdam Boston
The upward dashed curve

Smaller halls
What if we build a hall with the shape of
Smaller halls
What if we build a hall with the shape of

Half-Size Boston
The gap between the direct and the reverberation and the
Half-Size Boston
The gap between the direct and the reverberation and the

An existing small hall
An existing small hall of 350 seats has
An existing small hall
An existing small hall of 350 seats has

An existing small hall - pictures
Note the highly reflective stage and
An existing small hall - pictures
Note the highly reflective stage and

Small shoebox halls can be OK
If the client insists on a
Small shoebox halls can be OK
If the client insists on a

Great Small Halls Exist!
Jordan Hall at New England Conservatory has 1200
Great Small Halls Exist!
Jordan Hall at New England Conservatory has 1200

Williams Hall, NEC
Williams hall, in the same building, has ~350 seats
Williams Hall, NEC
Williams hall, in the same building, has ~350 seats

Hard learned lessons
Where clarity is a problem in small halls, acousticians
Hard learned lessons
Where clarity is a problem in small halls, acousticians

Clarity and involvement come from the direct sound. Spaciousness and envelopment
Clarity and involvement come from the direct sound. Spaciousness and envelopment

Why do current acousticians emphasize early reflections?
I believe the current emphasis
Why do current acousticians emphasize early reflections?
I believe the current emphasis

Threshold Data
Onset and azimuth thresholds allow hall sound to be predicted
Threshold Data
Onset and azimuth thresholds allow hall sound to be predicted

Experiment for threshold of Azimuth Detection in halls
A model is constructed
Experiment for threshold of Azimuth Detection in halls
A model is constructed

Threshold for azimuth detection as a function of T10
As the time
Threshold for azimuth detection as a function of T10
As the time

An important caveat!
All these thresholds were measured without visual cues
The author
An important caveat!
All these thresholds were measured without visual cues
The author

How to use the Thresholds
These thresholds provide guidelines for hall design.
How to use the Thresholds
These thresholds provide guidelines for hall design.
In practice the D/R is different than expected from classical acoustics
The
In practice the D/R is different than expected from classical acoustics
The

Light models
I ran across these pictures while cleaning out my office.
Light models
I ran across these pictures while cleaning out my office.

Modeling T10
Classical acoustics predicts a starting value for d/r. We can
Modeling T10
Classical acoustics predicts a starting value for d/r. We can

Onset Enhancement
When d/r is low a small amount of direct sound
Onset Enhancement
When d/r is low a small amount of direct sound

Small Hall Shapes
A large hall like Boston has many seats above
Small Hall Shapes
A large hall like Boston has many seats above

Retro reflectors above 1000Hz
Boston, Amsterdam, and Vienna all have side-wall and
Retro reflectors above 1000Hz
Boston, Amsterdam, and Vienna all have side-wall and

High frequency retro reflectors
Rectangular wall features scatter in three dimensions –
High frequency retro reflectors
Rectangular wall features scatter in three dimensions –

High frequency overhead filters
A canopy made of surfaces separated by some
High frequency overhead filters
A canopy made of surfaces separated by some

Binaural Measures
The author has been recording performances binaurally for years.
Current technology
Binaural Measures
The author has been recording performances binaurally for years.
Current technology

Localization
The figure shows the number of times per second that a
Localization
The figure shows the number of times per second that a

Localization – surface1
Here we plot the same data for the violin
Localization – surface1
Here we plot the same data for the violin

Localization, Surface 2
Here we plot 1/(1-IACC) as a function of time
Localization, Surface 2
Here we plot 1/(1-IACC) as a function of time

Localization – a poor seat
Here is a similar diagram for a
Localization – a poor seat
Here is a similar diagram for a

Measures based on harmonic coherence
When the formant frequencies above 1000Hz are
Measures based on harmonic coherence
When the formant frequencies above 1000Hz are

Another singer
The king (in Verdi’s Don Carlos) on the other
Another singer
The king (in Verdi’s Don Carlos) on the other

Some demos of eardrum recordings
These recordings have been equalized for loudspeaker
Some demos of eardrum recordings
These recordings have been equalized for loudspeaker
 Струнные смычковые инструменты. Деревянные духовые инструменты. Медные духовые инструменты
 Поздний период творчества А.С. Даргомыжского
 Элементы музыкальной грамоты
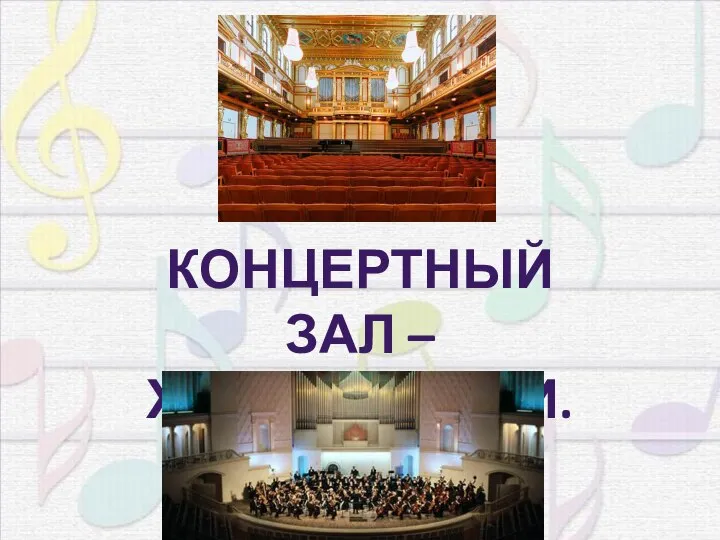 Концертный зал - презентация по музыке скачать бесплатно
 Серенада Трубадура, мультфильм Бременские музыканты
 «Казачья», слова и музыка Александра Розенбаума
 Использование ИКТ на уроках музыки
 Металисты Работу выполняли: Касапова Виктория Морозова Юлия (2012 год,11 класс)
 Музика XVII-XIX ст
 Музыкальная драматургия - развитие музыки.
  С Годовщиной Свадьбы Дорогие родители Серебренная свадьба 25 лет
  Группа "Water of life"
 Противные ноты
 Әміре Қашаубаев (1888-1934)
 Интервалы. Тест-игра
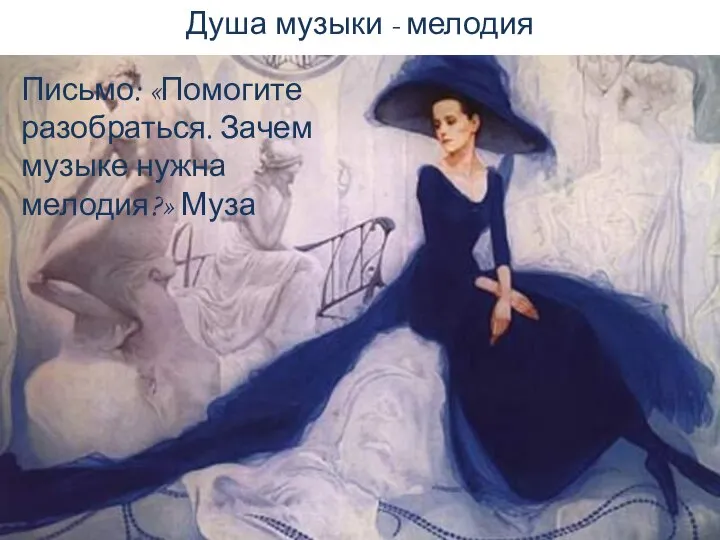 Душа музыки - мелодия
 My favorite word
 Музыкальная культура
 Симфоническое творчество Л. Бетховена Симфония №6 Пасторальная
 Творческое объединение "Студенты-композиторы Москвы". Учредительный концерт. Принимаются заявки на заочное участие в концер
 Литературно-музыкальная композиция для празднования 75-летия Победы
 Музыка Японии
 Строение музыкального творчества. Создание авторской песни
 Музыкальные инструменты
 Опера П.И. Чайковского Евгений Онегин
 Richard Wagner (1813-1883)
 Бах Иоганн Себастьян (1685-1750)
 Тестовые задания по сольфеджио для уч-ся 2-3 кл. ДШИ и ДМШ Тема «Трезвучия»